3 Rules for Choosing Between SQL and Python
Analysts at the world's top banks are automating their manual Excel work so they can spend less time creating baseline reports, and more time building new analyses that push the company forward.
These report automations often live in Jupyter Notebooks and use a combination of SQL and Python. Usually SQL is used in the first part of the script to access data, and Python is used in the latter parts of the report to analyze the data, create visualizations, and build the final output.
Transitioning from SQL to Python at the right point in the script can save you hours of development time. After three years of helping users automate Excel reports, here are 3 rules of thumb that we've developed.
SQL vs Python Rules of Thumb
Fundamentally, SQL is a specialized language designed for querying structured data in databases. Python, on the other hand, is a flexible programming language that has a variety of powerful libraries for performing complex data transformations, creating visualizations, sending emails, and generating Excel files.
Rule 1: Use SQL to import data.
The structure of the input data changing is the number one killer of report automations. Its trivial to design Python scripts that handle changes in row-level data, but hard to design Python scripts that handle changes in the structure of the data, ie: column headers.
Using a database as your data source is the best way to ensure the structure of your data is consistent each time you run the report. And the best way to read data from a database is by executing a SQL query.
For example, the query might look like this one that pulls key performance metrics about financial institutions.
SELECT ts.date, ts.value, ts.variable_name, ent.name
FROM fin_timeseries AS ts
JOIN fin_entities AS ent ON ts.ID_RSSD = ent.ID_RSSD
WHERE ts.date >= '2022-01-01';
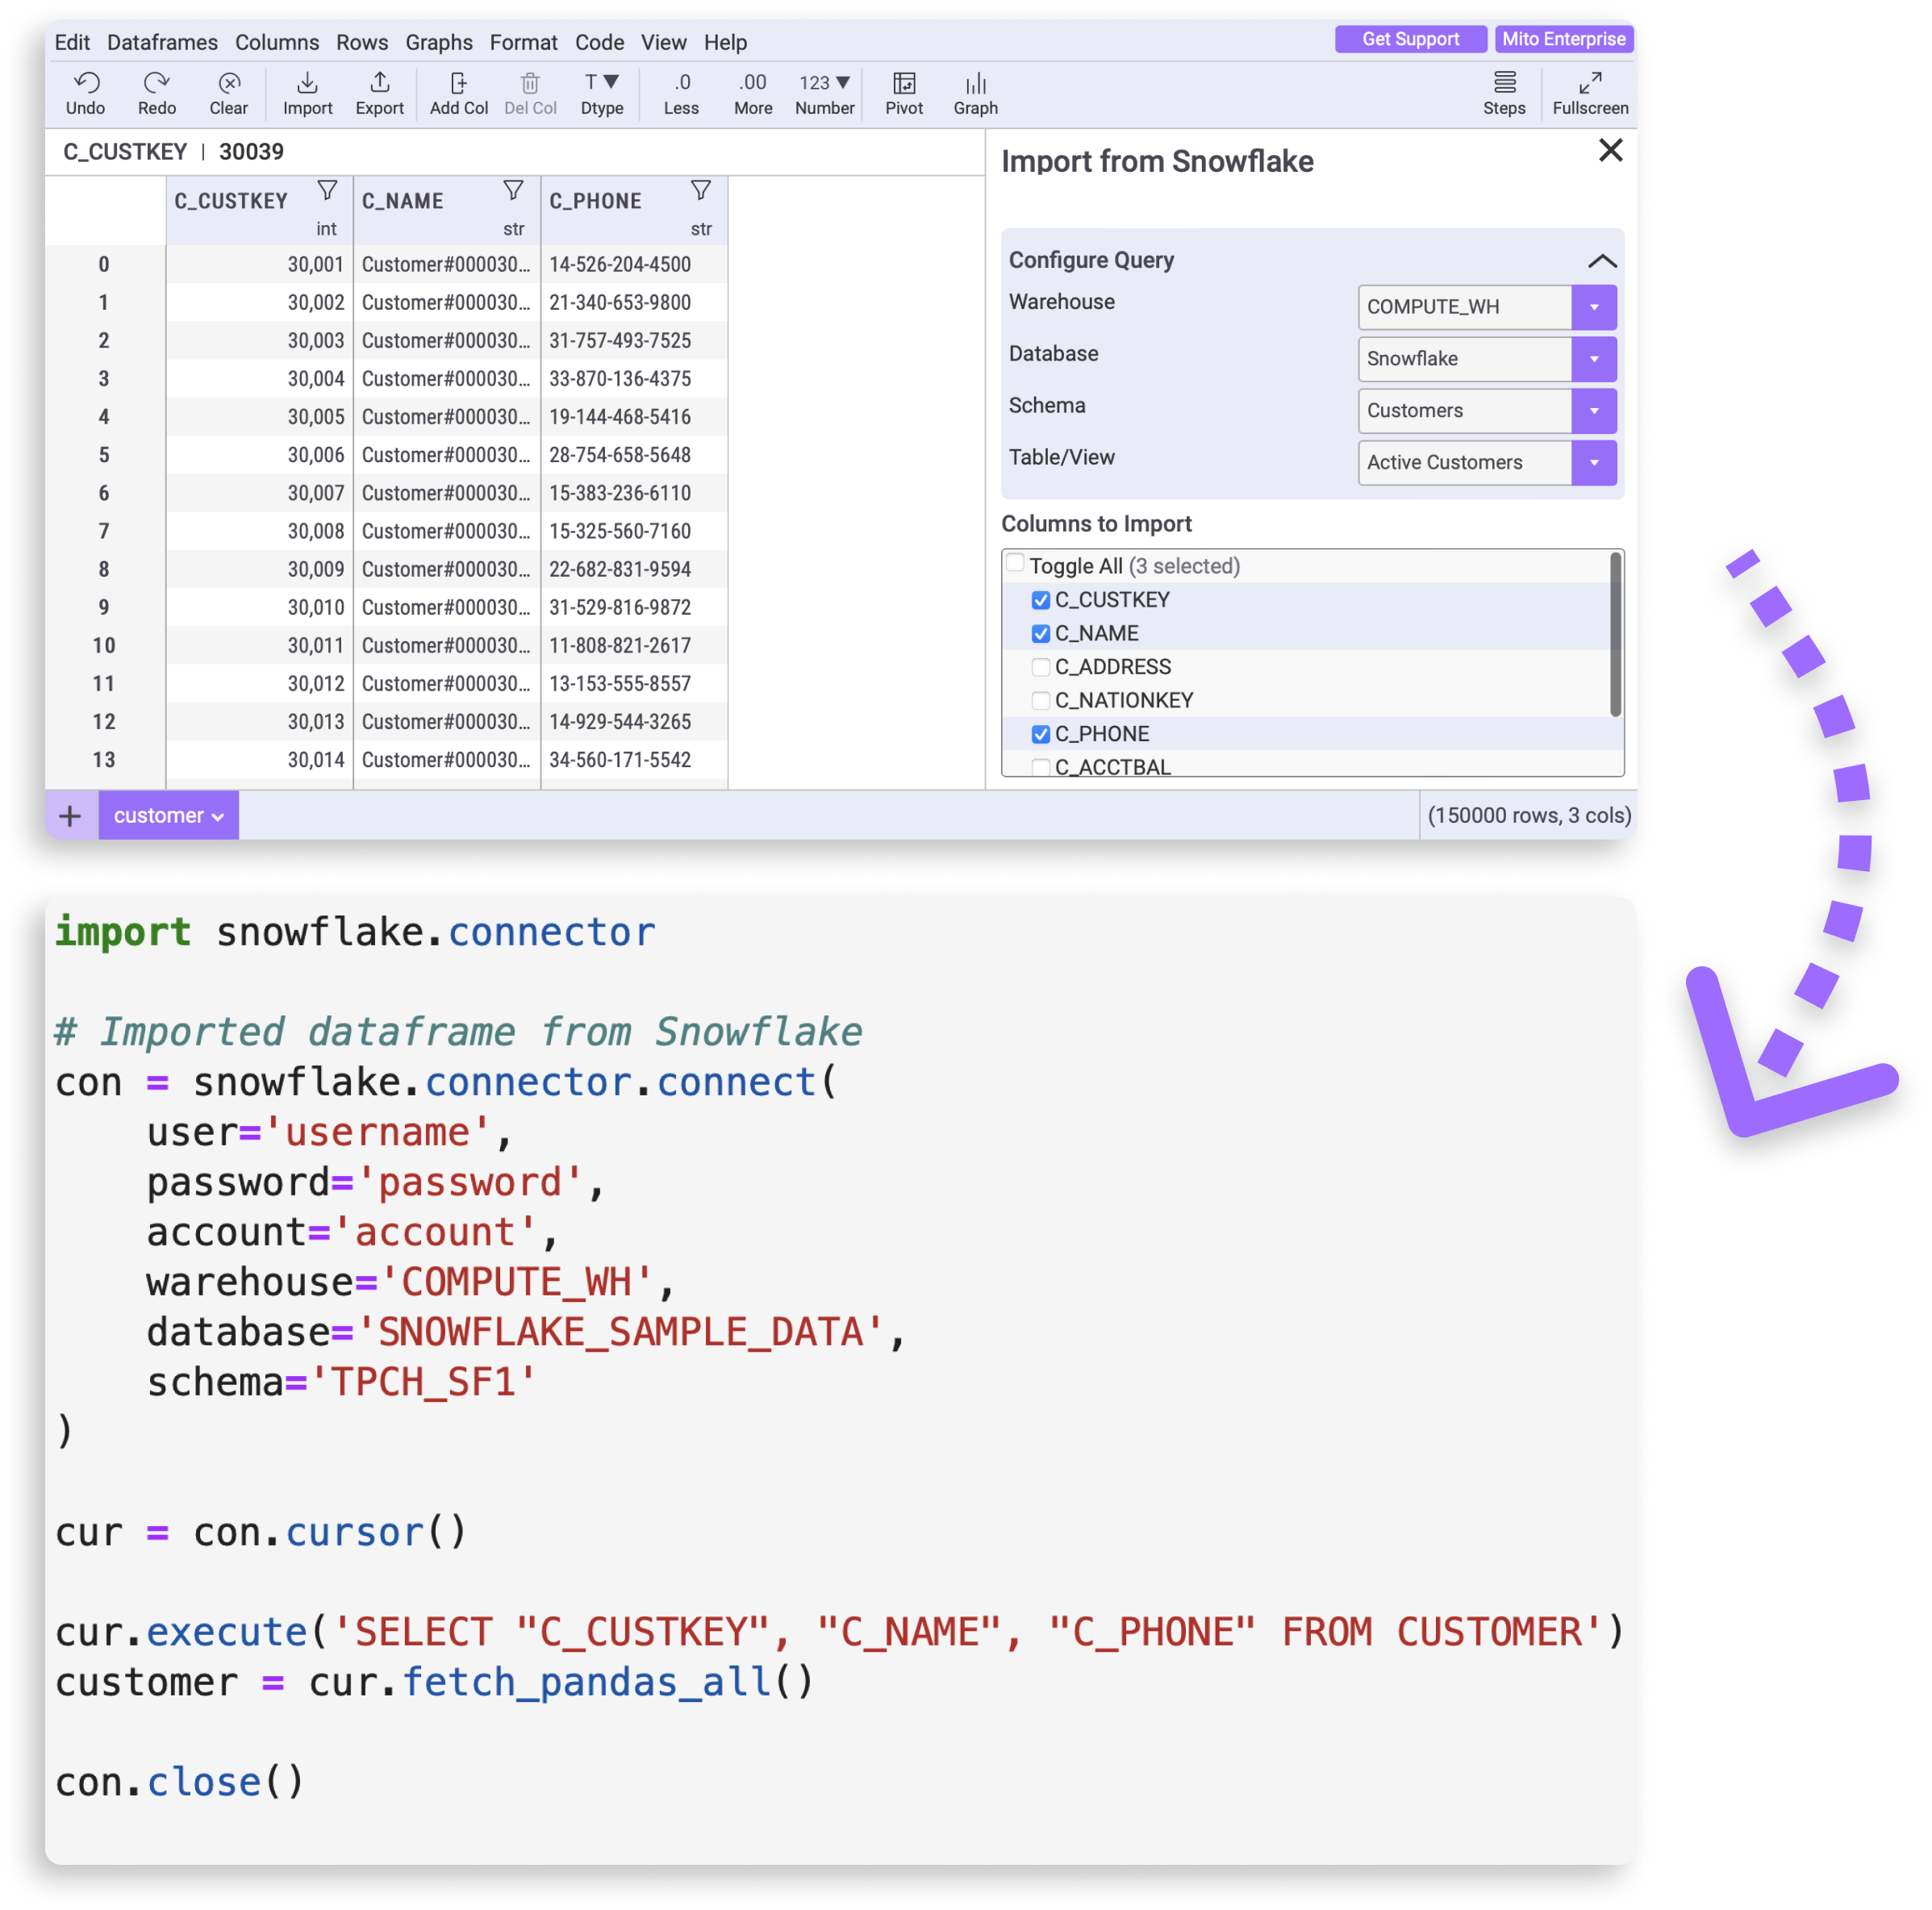
Since Jupyter notebooks can't natively run SQL code, a Python package like snowflake-connector-python is required. It lets us authenticate to the Snowflake database, execute the sql query, and return the data as a Pandas dataframe.
All together, the code looks like this:
import snowflake.connector

con = snowflake.connector.connect(
    user=USER,
    password=PASSWORD,
    account=ACCOUNT,
    warehouse='COMPUTE_WH',
    database='CYBERSYN_FINANCIAL__ECONOMIC_ESSENTIALS',
    schema='cybersyn'
)

cur = con.cursor()

bank_perf_query = """SELECT ts.date, ts.value, ts.variable_name, ent.name
FROM fin_timeseries AS ts
JOIN fin_entities AS ent ON ts.ID_RSSD = ent.ID_RSSD
WHERE ts.date >= '2022-01-01';"""

cur.execute(bank_perf_query)

bank_perf_df = cur.fetch_pandas_all()

con.close()
Rule 2: Use Python to configure SQL queries.
So far, we've taken a pretty simple approach to data importing – we have just one query that joines two tables and applies a simple filter. In practice, report automations often rely on multiple SQL queries.
For example, let's say that we didn't just care about key performance metrics, but we also wanted to know about each bank's total number of employees. Since this data lives in a different database and we want to do some data quality checks before merging the two datasets together, we're going to write a second SQL query:
SELECT emp.date, emp.number_employees
FROM fin_employees AS emp
JOIN fin_entities AS ent ON emp.ID_RSSD = ent.ID_RSSD
WHERE emp.date >= '2022-01-01';
Notice that in both of our SQL queries, we're filtering to records after January 1st, 2022. Hardcoding values into multiple SQL queries is a common source of errors. When updating the filter condition, it's easy to forget to update the value in every SQL query.
Instead of hardcoding these values, use Python variables and f-string to configure your SQL queries.
CUTOFF_DATE = '2022-01-01'

bank_perf_query = f"""SELECT ts.date, ts.value, ts.variable_name, ent.name
FROM fin_timeseries AS ts
JOIN fin_entities AS ent ON ts.ID_RSSD = ent.ID_RSSD
WHERE ts.date >= '{CUTOFF_DATE}';"""


bank_employee_query = f"""SELECT emp.date, emp.number_employees
FROM fin_employees AS emp
JOIN fin_entities AS ent ON emp.ID_RSSD = ent.ID_RSSD
WHERE emp.date >= '{CUTOFF_DATE}';"""
Now, to update the cutoff date in all of the queries, there's only one variable you need to update. This approach makes it easy to keep all of your queries in sync with eachother.
Rule 3: Move to Python as soon as possible.
Once the dataframe is constructed, use Python to build the the rest of the report automation. Python is far better for iterative script development than SQL for two reasons:
- Running SQL queries is slow if you have a lot of data.
- Python is a more flexible language.
Point one is self explanatory -- depending on how much data you're pulling, running the SQL query could take minutes to finish executing. Its better to pull the data into a Pandas dataframe and make iterative manipulations to the data already stored in memory rather than reload all of that data each time you make an edit.
To understand point two, let's continue our previous example. In a few cases, the bank key performance data has multiple entries for the same (date, bank name, variable name) tuple. For this analysis, we only care about the largest of the values reported if there are duplicates.
Using Python to clean the data:
To clean the data in Python, we can first sort the values in ascending order and then deduplicate the dataset, keeping the last value.
# Keep the largest value for each bank
df = df.sort_values(by='VALUE', ascending=True, na_position='first')
df = df.drop_duplicates(subset=['DATE', 'NAME', 'VARIABLE_NAME'], keep='last')
Its a simple two line addition to the end of our script.
Using SQL to clean the data:
To perform the same operation in SQL, we'd have to update our original query. Here's one way that we could achieve our desired result:
WITH RankedData AS (
    SELECT
        TO_DATE(ts.date) AS date,
        ts.value,
        ts.variable_name,
        ent.NAME,
        ROW_NUMBER() OVER (PARTITION BY TO_DATE(ts.date), ts.variable_name, ent.NAME ORDER BY ts.value DESC) AS RowNum
    FROM
        fin_timeseries AS ts
    JOIN
        fin_entities AS ent ON (ts.ID_RSSD = ent.ID_RSSD)
    WHERE
        ts.date >= '2022-01-01'
)
SELECT
    date,
    value,
    variable_name,
    NAME
FROM
    RankedData
WHERE
    RowNum = 1;
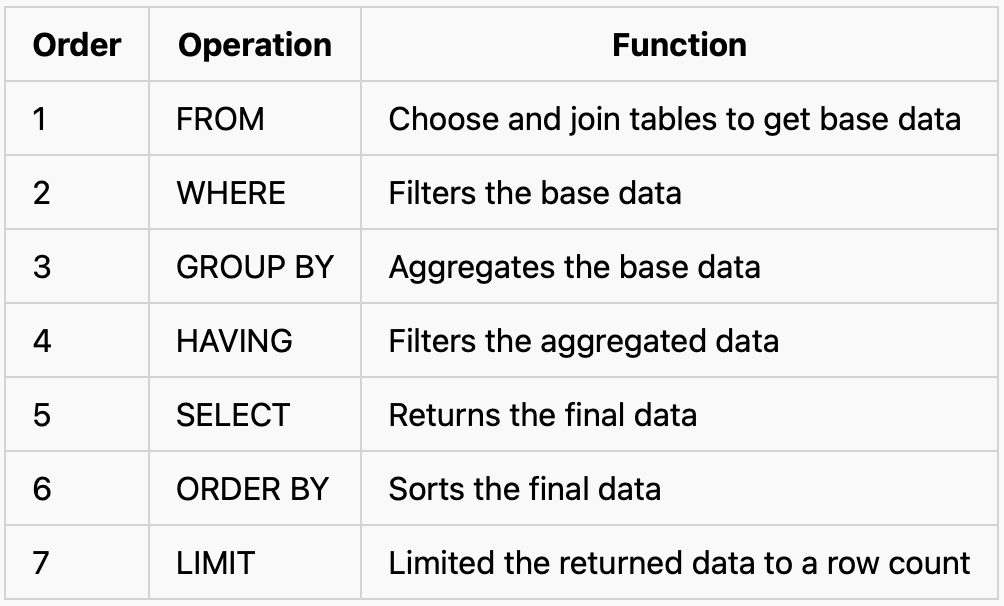
Notice that instead of just adding a couple of lines of code to deduplicate our data, we instead rewrote our entire query! Unlike in Python, where we can append lines of code to our script to edit the dataframe, SQL executes the entire query in a predefined order, not the order that the code is written.

So in order to deduplicate our data to find the maximum value, we can't just sort the data first and take the first entry*. Instead, this approach uses the ROW_NUMBER() window function to assign row numbers based on their descending ts.value. This allows us to rank the rows within each unique combination of date, variable_name, and NAME. Then, by filtering for rows with a row number of 1 in the main query, we effectively select the rows with the highest ts.value for each combination.
Data analytics is inherently an interative process, so the ability to quickly change our script, see the updated results, and continue making edits is crucial for velocity.
Mito automatically generates SQL and Python code
If figuring out when to use SQL and when to use Python is confusing, then Mito might be helpful to you. Mito is a spreadsheet extension for Jupyter and Streamlit that generates code for each edit you make. It automatically switches between writing SQL code when importing data from a database, and writing Python code when transforming data.
Learn more about Mito SQL and Python generation.

*there are several ways that we could've constructed this query to achieve the desired result. The approach you choose depends on the complexity of your data and your specific requirements. For example, we could've used the max function to aggregate the highest ts.value within each unique combination of date, variable_name, and name. However, this approach only works if we don't need other information associated with the highest value.